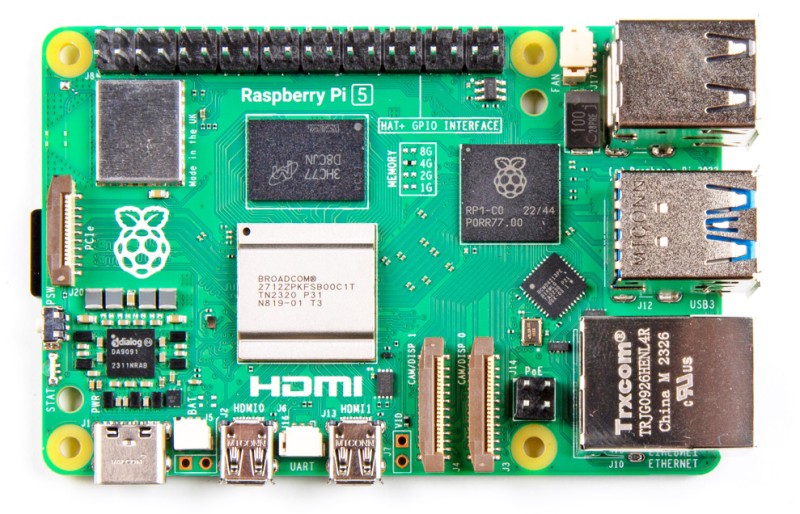
Flagship example: Raspberry Pi 5 Model B · Raspberry Pi · introduced 2023
Highlighted rows (★) are the most important CPUs of the family (Important - 1 in the result files). ST/GHz = single-core optimized score per 1 GHz; MT/W = multi-core optimized score per Watt of TDP. Click headers to sort.
| CPU Name◂ | Cores◂ | Clock MHz◂ | TDP W◂ | Score ST◂ | Score MT◂ | ST/GHz◂ | MT/W◂ | Text | Html |
|---|---|---|---|---|---|---|---|---|---|
| Raspberry Pi 5 / BCM2712 / Cortex A76 @ 2.40GHz ★ | 4 | 2,400 | 12.0 | 1,989 | 6,128 | 829 | 511 | Text | Html |
Each cell is the flagship’s score/GHz on one Livermore kernel, colored by where it sits among every CPU ever measured (red = bottom, green = top, log scale). Hover a column header for the kernel name.
| CPU | L1 | L2 | L3 | L4 | L5 | L6 | L7 | L8 | L9 | L10 | L11 | L12 | L13 | L14 | L15 | L16 | L17 | L18 | L19 | L20 | L21 | L22 | L23 | L24 |
|---|---|---|---|---|---|---|---|---|---|---|---|---|---|---|---|---|---|---|---|---|---|---|---|---|
| Raspberry Pi 5 / BCM2712 / Cortex A76 @ 2.40GHz score/GHz, percentile-colored vs all CPUs | 2,552 | 721 | 1,030 | 791 | 376 | 575 | 3,323 | 1,852 | 1,715 | 728 | 420 | 818 | 277 | 459 | 1,110 | 623 | 668 | 1,838 | 430 | 870 | 1,901 | 625 | 799 | 334 |