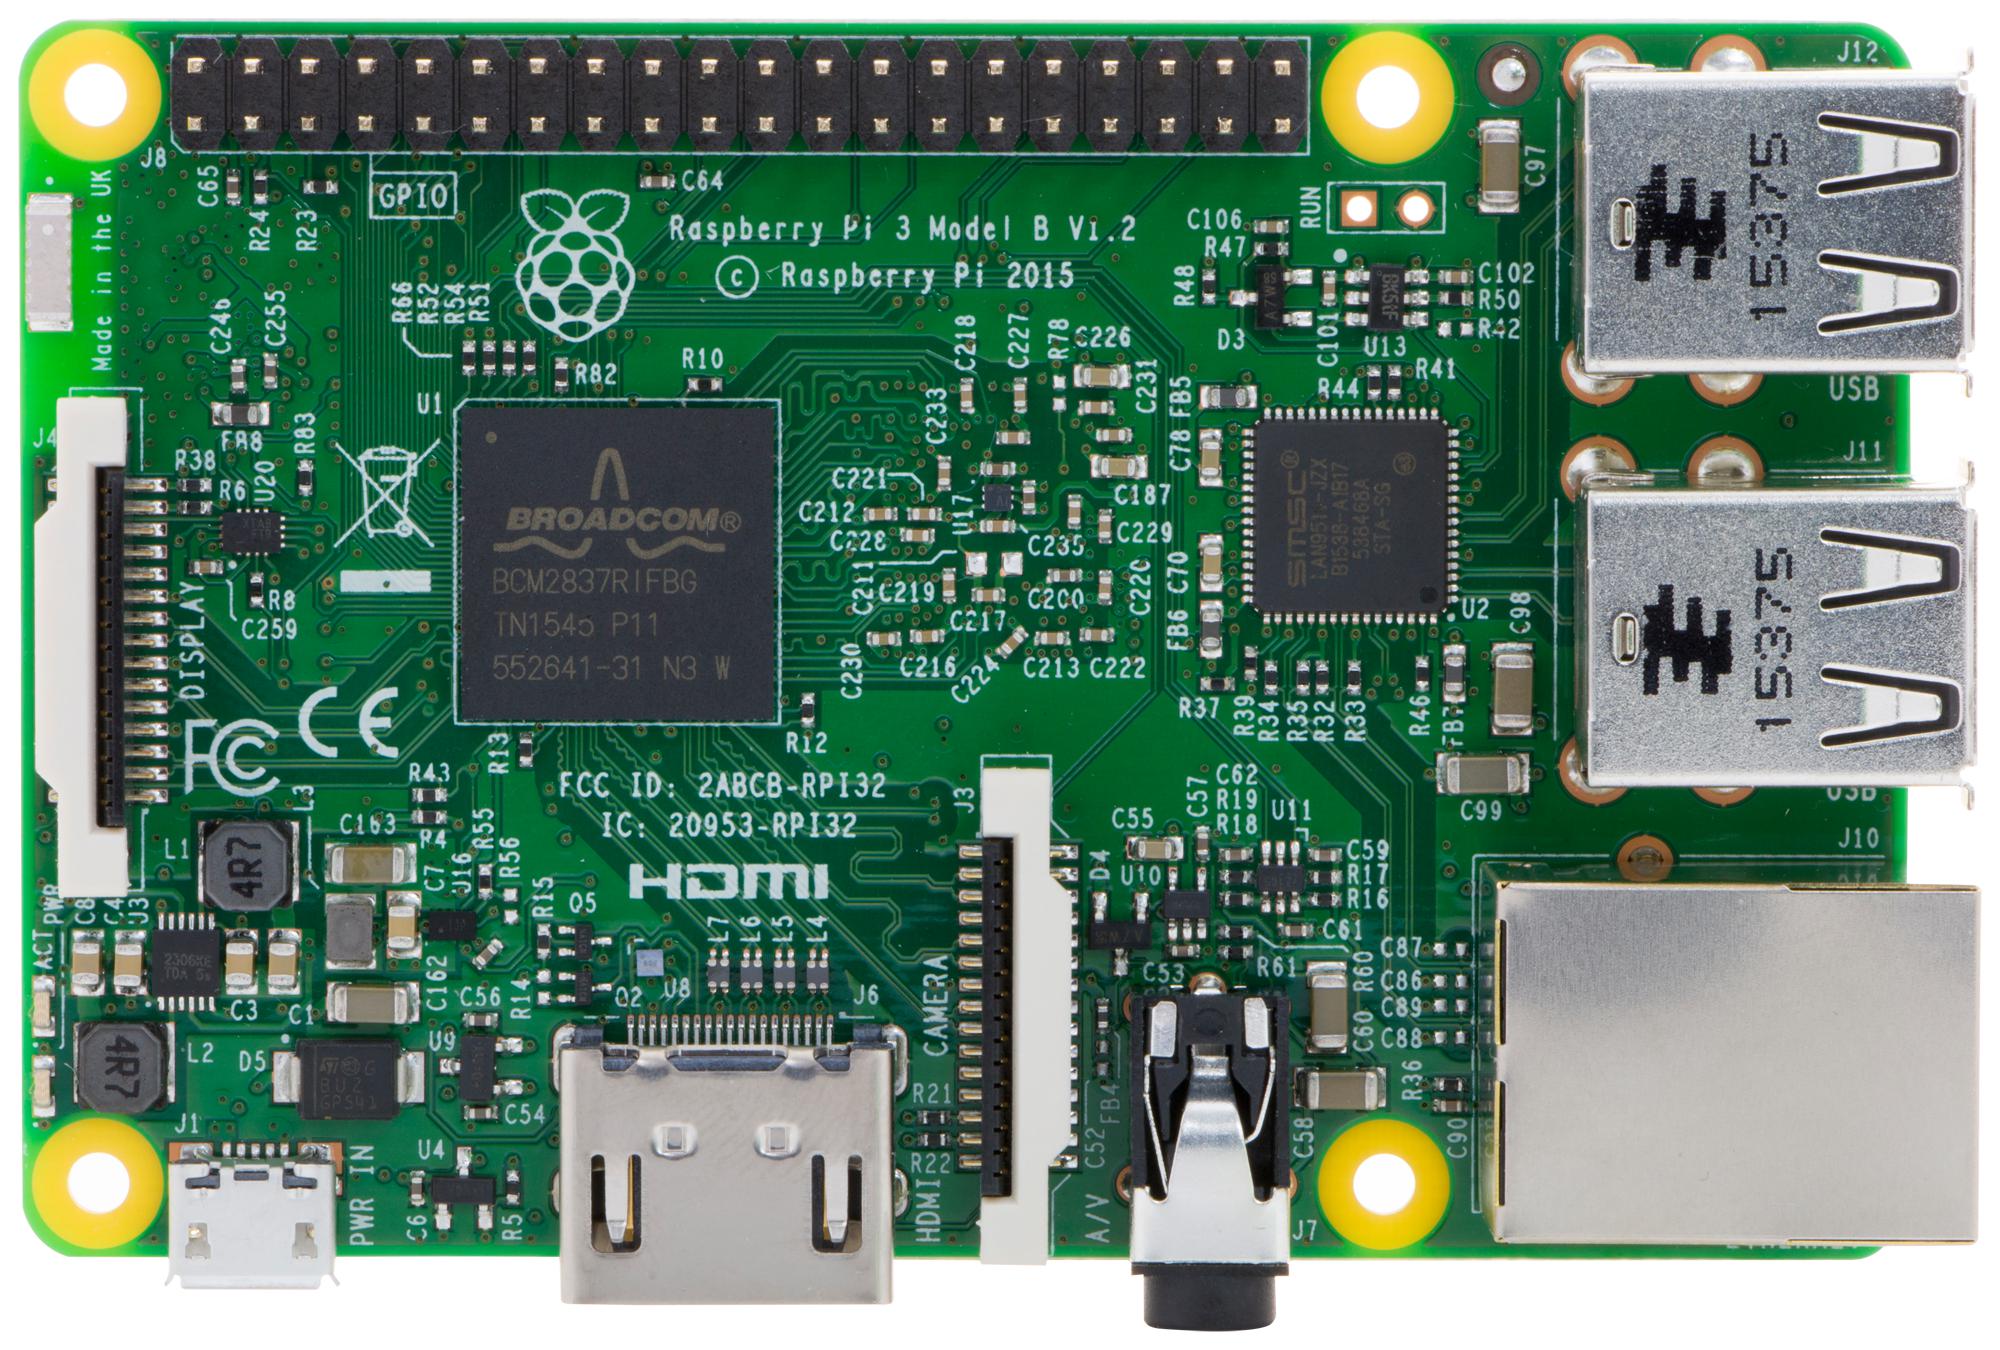
Flagship example: Raspberry Pi 3 Model B · Raspberry Pi · introduced 2016
Highlighted rows (★) are the most important CPUs of the family (Important - 1 in the result files). ST/GHz = single-core optimized score per 1 GHz; MT/W = multi-core optimized score per Watt of TDP. Click headers to sort.
| CPU Name◂ | Cores◂ | Clock MHz◂ | TDP W◂ | Score ST◂ | Score MT◂ | ST/GHz◂ | MT/W◂ | Text | Html |
|---|---|---|---|---|---|---|---|---|---|
| Raspberry Pi 3 / BCM2837 / Cortex A53 @ 1.20GHz ★ | 4 | 1,200 | 6.00 | 267 | 1,013 | 222 | 169 | Text | Html |
Each cell is the flagship’s score/GHz on one Livermore kernel, colored by where it sits among every CPU ever measured (red = bottom, green = top, log scale). Hover a column header for the kernel name.
| CPU | L1 | L2 | L3 | L4 | L5 | L6 | L7 | L8 | L9 | L10 | L11 | L12 | L13 | L14 | L15 | L16 | L17 | L18 | L19 | L20 | L21 | L22 | L23 | L24 |
|---|---|---|---|---|---|---|---|---|---|---|---|---|---|---|---|---|---|---|---|---|---|---|---|---|
| Raspberry Pi 3 / BCM2837 / Cortex A53 @ 1.20GHz score/GHz, percentile-colored vs all CPUs | 380 | 227 | 378 | 295 | 161 | 116 | 614 | 395 | 388 | 190 | 120 | 157 | 88.3 | 145 | 216 | 198 | 291 | 380 | 222 | 197 | 280 | 146 | 264 | 123 |