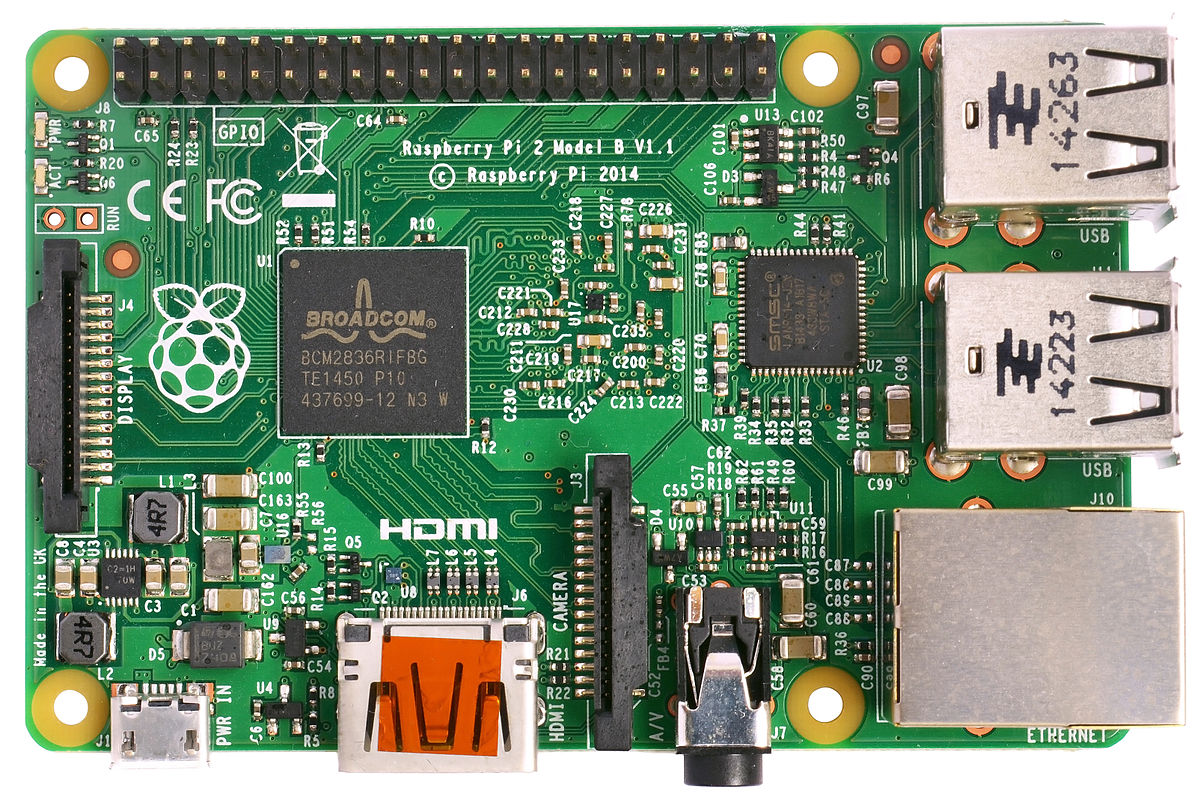
Flagship example: Raspberry Pi 2 Model B · Raspberry Pi · introduced 2015
Highlighted rows (★) are the most important CPUs of the family (Important - 1 in the result files). ST/GHz = single-core optimized score per 1 GHz; MT/W = multi-core optimized score per Watt of TDP. Click headers to sort.
| CPU Name◂ | Cores◂ | Clock MHz◂ | TDP W◂ | Score ST◂ | Score MT◂ | ST/GHz◂ | MT/W◂ | Text | Html |
|---|---|---|---|---|---|---|---|---|---|
| Raspberry Pi 2 / BCM2836 / Cortex A7 @ 900 MHz ★ | 4 | 900 | 4.00 | 136 | 539 | 151 | 135 | Text | Html |
Each cell is the flagship’s score/GHz on one Livermore kernel, colored by where it sits among every CPU ever measured (red = bottom, green = top, log scale). Hover a column header for the kernel name.
| CPU | L1 | L2 | L3 | L4 | L5 | L6 | L7 | L8 | L9 | L10 | L11 | L12 | L13 | L14 | L15 | L16 | L17 | L18 | L19 | L20 | L21 | L22 | L23 | L24 |
|---|---|---|---|---|---|---|---|---|---|---|---|---|---|---|---|---|---|---|---|---|---|---|---|---|
| Raspberry Pi 2 / BCM2836 / Cortex A7 @ 900 MHz score/GHz, percentile-colored vs all CPUs | 181 | 147 | 240 | 203 | 149 | 101 | 254 | 223 | 230 | 188 | 160 | 143 | 66.0 | 86.9 | 141 | 121 | 217 | 163 | 171 | 147 | 138 | 76.3 | 186 | 104 |