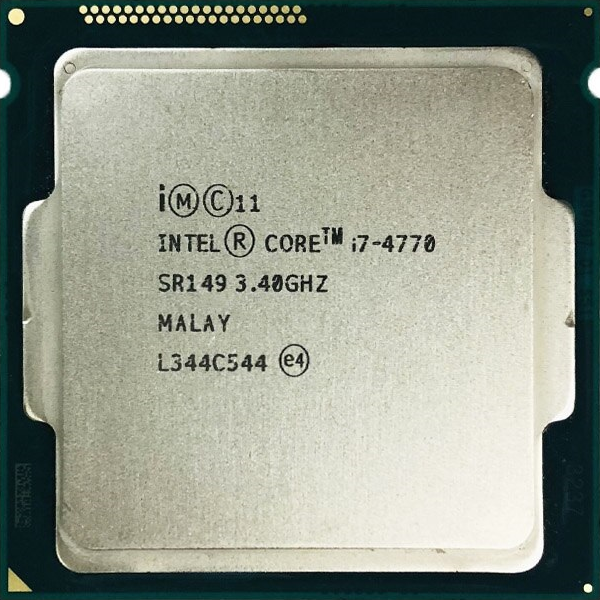
Flagship example: Core i7-4770 · Intel · introduced 2013
Highlighted rows (★) are the most important CPUs of the family (Important - 1 in the result files). ST/GHz = single-core optimized score per 1 GHz; MT/W = multi-core optimized score per Watt of TDP. Click headers to sort.
| CPU Name◂ | Cores◂ | Clock MHz◂ | TDP W◂ | Score ST◂ | Score MT◂ | ST/GHz◂ | MT/W◂ | Text | Html |
|---|---|---|---|---|---|---|---|---|---|
| Intel(R) Core(TM) i7-4770 CPU @ 3.40GHz ★ | 8 | 3,900 | 84.0 | 2,867 | 14,045 | 735 | 167 | Text | Html |
| Intel(R) Core(TM) i5-4570 CPU @ 3.20GHz ★ | 4 | 3,600 | 45.0 | 2,596 | 9,815 | 721 | 218 | Text | Html |
| Intel(R) Core(TM) i7-4790 CPU @ 3.60GHz | 8 | — | — | 2,961 | 14,755 | — | — | Text | Html |
| Intel(R) Core(TM) i3-4150 CPU @ 3.50GHz | 4 | — | — | 2,589 | 6,705 | — | — | Text | Html |
| Intel(R) Core(TM) i5-4300U CPU @ 1.90GHz | 4 | — | — | 2,134 | 4,894 | — | — | Text | Html |
Each cell is the flagship’s score/GHz on one Livermore kernel, colored by where it sits among every CPU ever measured (red = bottom, green = top, log scale). Hover a column header for the kernel name.
| CPU | L1 | L2 | L3 | L4 | L5 | L6 | L7 | L8 | L9 | L10 | L11 | L12 | L13 | L14 | L15 | L16 | L17 | L18 | L19 | L20 | L21 | L22 | L23 | L24 |
|---|---|---|---|---|---|---|---|---|---|---|---|---|---|---|---|---|---|---|---|---|---|---|---|---|
| Intel(R) Core(TM) i7-4770 CPU @ 3.40GHz score/GHz, percentile-colored vs all CPUs | 2,775 | 934 | 631 | 825 | 321 | 519 | 3,444 | 1,453 | 1,814 | 785 | 394 | 900 | 348 | 422 | 593 | 701 | 651 | 1,533 | 272 | 269 | 2,195 | 462 | 595 | 407 |