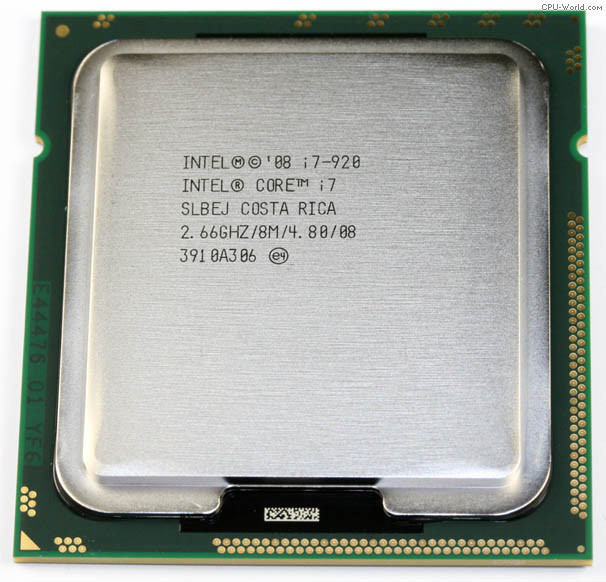
Flagship example: Core i7-920 · Intel · introduced 2008
Highlighted rows (★) are the most important CPUs of the family (Important - 1 in the result files). ST/GHz = single-core optimized score per 1 GHz; MT/W = multi-core optimized score per Watt of TDP. Click headers to sort.
| CPU Name◂ | Cores◂ | Clock MHz◂ | TDP W◂ | Score ST◂ | Score MT◂ | ST/GHz◂ | MT/W◂ | Text | Html |
|---|---|---|---|---|---|---|---|---|---|
| Intel(R) Core(TM) i7 CPU 870 @ 2.93GHz ★ | 8 | 3,600 | 95.0 | 1,973 | 9,011 | 548 | 94.9 | Text | Html |
Each cell is the flagship’s score/GHz on one Livermore kernel, colored by where it sits among every CPU ever measured (red = bottom, green = top, log scale). Hover a column header for the kernel name.
| CPU | L1 | L2 | L3 | L4 | L5 | L6 | L7 | L8 | L9 | L10 | L11 | L12 | L13 | L14 | L15 | L16 | L17 | L18 | L19 | L20 | L21 | L22 | L23 | L24 |
|---|---|---|---|---|---|---|---|---|---|---|---|---|---|---|---|---|---|---|---|---|---|---|---|---|
| Intel(R) Core(TM) i7 CPU 870 @ 2.93GHz score/GHz, percentile-colored vs all CPUs | 2,313 | 595 | 652 | 614 | 245 | 442 | 2,541 | 1,383 | 1,495 | 439 | 346 | 623 | 147 | 309 | 304 | 444 | 582 | 994 | 252 | 248 | 1,526 | 310 | 545 | 318 |