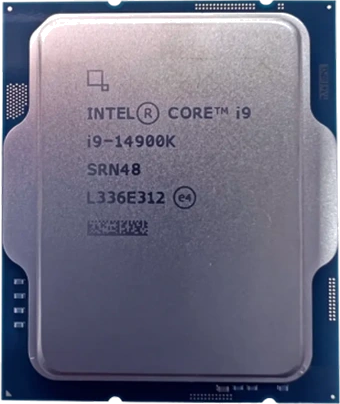
Flagship example: Core i9-14900K · Intel · introduced 2023
Highlighted rows (★) are the most important CPUs of the family (Important - 1 in the result files). ST/GHz = single-core optimized score per 1 GHz; MT/W = multi-core optimized score per Watt of TDP. Click headers to sort.
| CPU Name◂ | Cores◂ | Clock MHz◂ | TDP W◂ | Score ST◂ | Score MT◂ | ST/GHz◂ | MT/W◂ | Text | Html |
|---|---|---|---|---|---|---|---|---|---|
| Intel(R) Core(TM) i9-14900K ★ | 32 | 6,000 | 300 | 7,256 | 128,782 | 1,209 | 429 | Text | Html |
Each cell is the flagship’s score/GHz on one Livermore kernel, colored by where it sits among every CPU ever measured (red = bottom, green = top, log scale). Hover a column header for the kernel name.
| CPU | L1 | L2 | L3 | L4 | L5 | L6 | L7 | L8 | L9 | L10 | L11 | L12 | L13 | L14 | L15 | L16 | L17 | L18 | L19 | L20 | L21 | L22 | L23 | L24 |
|---|---|---|---|---|---|---|---|---|---|---|---|---|---|---|---|---|---|---|---|---|---|---|---|---|
| Intel(R) Core(TM) i9-14900K score/GHz, percentile-colored vs all CPUs | 4,080 | 1,292 | 1,575 | 1,443 | 568 | 845 | 5,385 | 2,571 | 2,691 | 1,308 | 578 | 1,353 | 635 | 762 | 1,632 | 1,043 | 1,056 | 3,096 | 333 | 360 | 3,120 | 1,082 | 935 | 429 |