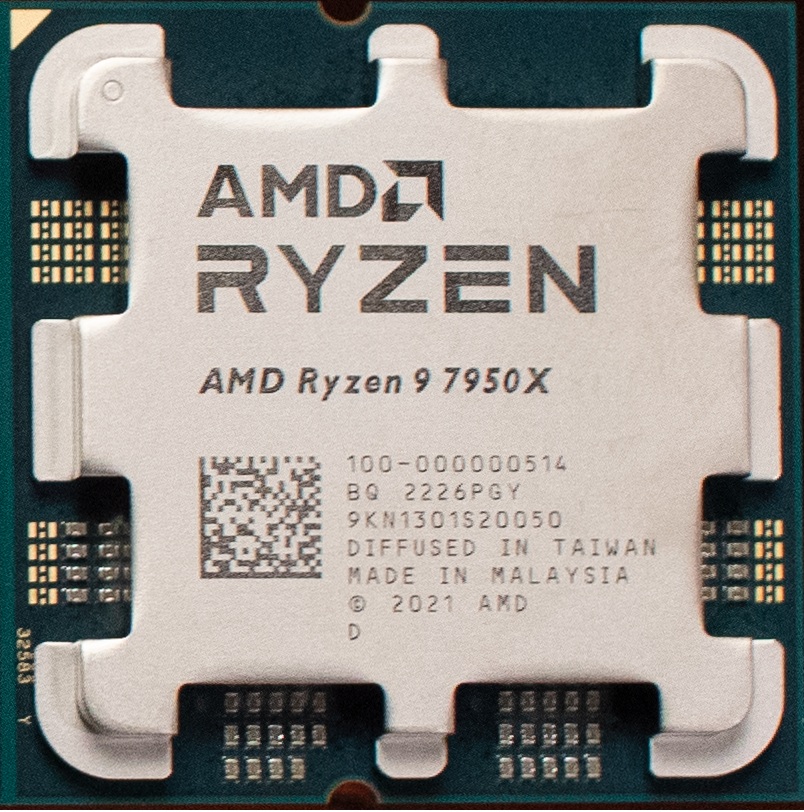
Flagship example: AMD Ryzen 9 7950X · AMD · introduced 2022
Highlighted rows (★) are the most important CPUs of the family (Important - 1 in the result files). ST/GHz = single-core optimized score per 1 GHz; MT/W = multi-core optimized score per Watt of TDP. Click headers to sort.
| CPU Name◂ | Cores◂ | Clock MHz◂ | TDP W◂ | Score ST◂ | Score MT◂ | ST/GHz◂ | MT/W◂ | Text | Html |
|---|---|---|---|---|---|---|---|---|---|
| AMD Ryzen 9 7950X 16-Core Processor / ECO-mode 65/88 watt TDP ★ | 32 | 5,700 | 88.0 | 6,053 | 85,540 | 1,062 | 972 | Text | Html |
| AMD Ryzen 9 7950X 16-Core Processor ★ | 32 | 5,700 | 230 | 5,962 | 106,943 | 1,046 | 465 | Text | Html |
| AMD Ryzen 7 7700 8-Core Processor | 16 | 5,300 | 88.0 | 6,024 | 51,080 | 1,137 | 580 | Text | Html |
| AMD Ryzen 9 7900X 12-Core Processor | 24 | — | — | 5,774 | 82,270 | — | — | Text | Html |
| AMD Ryzen 9 7900 12-Core Processor | 24 | 5,400 | 88.0 | 5,744 | 76,926 | 1,064 | 874 | Text | Html |
Each cell is the flagship’s score/GHz on one Livermore kernel, colored by where it sits among every CPU ever measured (red = bottom, green = top, log scale). Hover a column header for the kernel name.
| CPU | L1 | L2 | L3 | L4 | L5 | L6 | L7 | L8 | L9 | L10 | L11 | L12 | L13 | L14 | L15 | L16 | L17 | L18 | L19 | L20 | L21 | L22 | L23 | L24 |
|---|---|---|---|---|---|---|---|---|---|---|---|---|---|---|---|---|---|---|---|---|---|---|---|---|
| AMD Ryzen 9 7950X 16-Core Processor / ECO-mode 65/88 watt TDP score/GHz, percentile-colored vs all CPUs | 4,482 | 1,135 | 1,117 | 1,154 | 489 | 551 | 4,822 | 2,443 | 2,399 | 1,243 | 532 | 1,487 | 513 | 638 | 1,165 | 1,060 | 821 | 2,643 | 321 | 372 | 2,845 | 802 | 739 | 488 |